Real-Time Analytics Lectures for SGH students
Lecture 1 - Small Data
Stream processing technology is becoming more and more popular with big and small companies because it provides superior solutions for many stablished use cases such as data analytics, ETL, transactional apps, software architectures, and business opportunities. We try describe why stateful stream processing is becoming so popular and assess it’s potential.
But first we start by reviewing classical data apps architectures and point out their limitations.
Data -> Small Data -> …
The development of information technology has resulted in access to unimaginable amounts of a new resource which are structured and unstructured data.
Data has contributed to the development of thousands of new tools for generating, collecting, storing and processing information on an unprecedented scale.
The emergence of new scientific or business challenges becomes possible thanks to the construction of systems based on open software, as well as thanks to the use of home computers to support the processing of huge amounts of data.
The new kind of busines and scientific challenges include:
- intelligent advertising of thousands of products for millions of customers,
- processing of data about genes, RNA or proteins genus,
- intelligent detection of various methods of fraud among hundreds of billions of credit card transactions,
- stock market simulations based on thousands of financial instruments,
- recognizing billions of cases of the effects of proton collisions and the production of elementary particles at the LHC
- Bitcoin and other currencies,
- quantum communication,
- quantum encryption.
Today systems such as SAS, Apache Hadoop, Apache Spark, Apache Flink or Microsoft Azure are used on a large scale in many institutions and companies in almost every field. These companies create solutions in banking, healthcare, life sciences, manufacturing and the public sector and sales.
The data age presents us with newer and newer challenges related not only to the quantity, but also to the time of data processing.
All machine learning algorithms require structured data written in a tabular form. They are organized in columns of characteristics that characterize each observation (rows). An example may be such features as: sex, growth or number of owned cars, of which it can be predicted whether the customer will repay the loan or not. This prediction is also collected as a feature. Thanks to the tables of features obtained in this way, we can use XGBoost or logistic regression algorithms to determine the appropriate combination of variables affecting the probability of a good or bad customer.
Unstructured data is data that is not arranged in a tabular form. Examples include sound, images and text. In the process of processing, they are always converted into some vector form. However, individual letters, frequencies or pixels do not convey any information. They do not create separate features, which is crucial to distinguish them from structured data.
Give an example of structured and unstructured data. Load sample data in jupyter notebook.
Knows the types of structured and unstructured data (K2A_W02, K2A_W04, O2_W04, O2_W07)
Data sources
[Big Data Flow] (https://www.internetlivestats.com)
- Activities of enterprises and institutions (banks, insurance companies, retail chains, offices …).
The three largest data generators are:
- social data in the form of texts (tweets, entries in social networks, comments), photos or videos. These data are very important due to their wide possibilities of analysis in terms of consumer behavior and sentiment in marketing analyzes.
- data from all kinds of sensors or logs of the operation of devices and users (e.g. on a website). These data are related to IoT (Internet of Things) technology, which is currently one of the most developing areas in data processing, but also in the business direction.
-
Transaction data, that is generally what is always generated as transactions appearing both online and offline. Currently, this type of data is processed for the purpose of not only performing transactions, but also rich analytics supporting virtually every area of everyday life.
- Research centers: $10^9$ astronomical records, $10^2\sim 10^3$ attributes in medical diagnostic systems, 30 petabytes per year at the LHC. The Very Long Baseline Interferometry has 16 telescopes, each producing 1 Gigabit / sec of astronomical data during a 25 day observing session.
- The BrainMaps contains over 50 TB of data with mammalian brain maps.
- NYSE 4-5 terabytes per day
- Facebook - 7 petabytes per month
- Ancestry.com family tree - $>$ 10 petabytes of data
- One of the largest data sources is currently the WEB network WorldWideWebSize.com.
(Thursday, 14 February, 2019) at least 5.55 billion pages .
(Friday, 14 August, 2020) at least 5.72 billion pages .
(Sunday, 17 October, 2021) at least 2.84 billion pages.
From the business side:
- Single human generated data stream is growing rapidly - MyLifeBits
- The largest data increase is expected under IoT (sensors, GPS traces, commercial transactions, etc.)
- Companies cannot just manage their own data !!! SUCCESS = Ability to get value from other company data.
- How to process publicly available data? Project Public Data Sets
- Project Astrometry - analysis of photos from Flickr to identify stars and other objects.
How to archive personal information that may be available for general use?
not to Big Data
,,Big Data is like teenage sex: everyone talks about it, nobody really knows how to do it, everyone thinks everyone else is doing it, so every one claims they are doing it.’‘ — Dan Ariely, Professor of Psychology and Behavioral Economics, Duke University
one, two, … four V
- Volume - the size of the data produced worldwide is growing exponentially. Huge amounts of data are being genereted every second - the email you send, Twitter, Facebook, or other social media, videos, pictures, SMS messages, call records and data from varied devices and sensors.
- Velocity - the speed of data production, the speed of their transfer and processing.
- Variety - we associate traditional data with an alphanumeric form composed of letters and numbers. Currently, we have images, sounds, videos, IoT data streams at our disposal
- Veracity - Is the data complete and correct? Do they objectively reflect reality? Are they the basis for making decisions?
- Value - The value that the data actually holds. In the end, it’s all about cost and benefits.
_ The purpose of calculations is not numbers, but understanding them_ R.W. Hamming 1962.
As You can see data and data processing have been omnipresent in businesses for many decades. Over the years the collection and usage of data has grown consistently, and companies have designed and build infrastructures to manage that data.
Some history
- 1960s: Data collections, databases, network DNBMS
- 1970s: Relational data models and their implementation in OLTP systems
- 1980s: Advanced data models, extended-relational, objective oriented, application-oriented, etc.
- 1990s: Data mining, data warehouses, multimedia databases, OLAP systems
- Later: NoSQL, Hadoop, SPARK, data lake
Knows the history and philosophy of data processing models.
Data processing models
The traditional architecture that most businesses implement distinguises two types of data processing.
Most of the data is stored in databases or data warehouses. By default, access to data comes down to the implementation of queries via applications. The method of using and implementing the database access process is called the processing model. Two implementations are most commonly used:
Traditional Model
Traditional model - on-line transaction processing, OLTP (on-line transaction processing). It works great in the case of ongoing service, e.g. customer service, order register, sales service, etc. Companies use all kinds of applications for their day-to-day business activities, such as Enterprise Resource Planning (ERP) Systems, Customer Relationship Management (CRM) software, and web-based applications. These systems are typically designed with separate tiers for data processing and data storage (transactional database system).
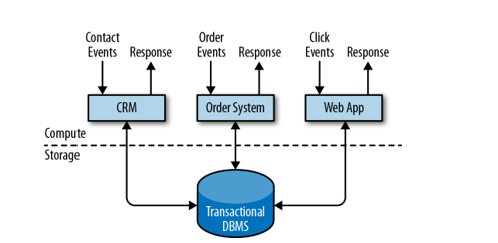
Applications are usually connected to external services or face human usera and continuously process incoming events such as orders, email, or clicks on a website.
When an event is processed, an application reads its state or updates it by running transactions against the remote database system. Often, a database system serves multiple applications that sometimes access the same databases or tables.
This model provides effective solutions for:
- effective and safe data storage,
- transactional data recovery after a failure,
- data access optimization,
- concurrency management,
- event processing -> read -> write
And what if we are dealing with:
- aggregation of data from many systems (e.g. for many stores),
- supporting data analysis,
- data reporting and summaries,
- optimization of complex queries,
- supporting business decisions.
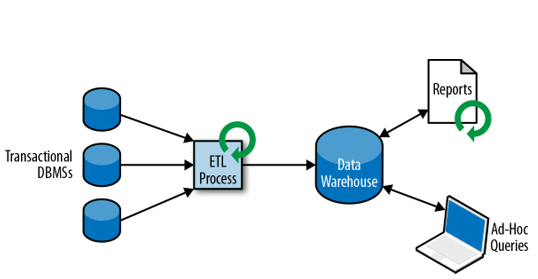
Research on such issues has led to the formulation of a new data processing model and a new type of database (Data warehouse).
This application designe can cause problems when applications need to evolve or scale. Since multiple applications might work on the same data representation or share the same infrastructure, changing the schema of a table or scaling data base system requires careful planning and a lot of effort. Currently many running applications (even in one area) are implemented as microservices, i.e. small and independent applications (LINUX programming philosophy - do little but right). Because microservices are stricly decoupled from each other and only communicate over well-definedinterfaces, each microservice can be implemented with a different technology stack including a programming language, libraries and datastores.
OLAP Model
On-line analytic processing (OLAP).
Supporting analysis processes and providing tools enabling multidimensional analysis (time, place, product).
The process of dumping data from different systems into one database is called Extract-Transform-Load (ETL) (normalization and encoding and schema transaction).
The analysis of data from the warehouse is mainly the calculation of aggregates (summaries) of the dimensions of the warehouse. This process is completely user controlled.
Example
Suppose we have access to a data warehouse where information on the sale of products in the supermarket is stored. How to parse queries:
- What is the total sale of products in the following quarters, months and weeks?
- What is the sale of products broken down into product types?
- What is the sale of products broken down by supermarket divisions?
Answers to these questions allow to identify bottlenecks in the sale of deficit products, plan inventory in warehouses or compare the sales of different groups in different supermarket branches.
As part of the Data Warehouse, two types of inquiries are most often performed:
- Periodic reporting queries to calculate business statistics
- Ad-hoc queries supporting critical business decisions.
Both are performed in batch mode. Today they are strictly made using Hadoop technology.
Data Mining, Machine Leraning AI …
While these systems were based on their construction based on previously known queries, “data mining” allows you to discover completely new, previously unknown facts, patterns and correlations (very often confused with causes).